Friday, August 28, 2015

Aqumin Volatility Newsletter 8-28-15 $SPX $BTU

Smoking Volatility

As Friday rolls to a close stocks have seen some near record levels of volatility. If the VIX could have opened early Monday morning we would have touched 80% on that crazy downward spike. Notice there is no Financial Crisis currently. The funny thing is that was almost cheap. Traders know that when things get out of hand the most valuable commodity is gamma. Having some would have helped a whole lot on Monday.

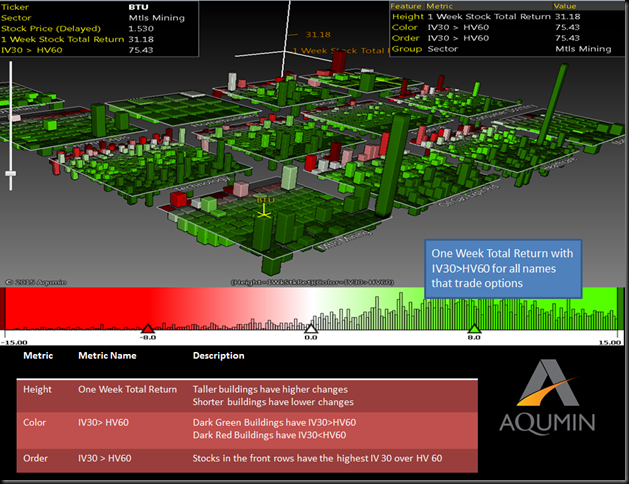
On a volatile week the Metals and Mining groups showed the highest IV. Note that in the OptionVision™ Implied Volatility (IV) landscape, Mtls and Mining show the highest average IV over the 60 day realized volatility. The meltdown in China basically left that segment in tatters and it only is just recovering or trying to. The IV still remains high as the future is totally murky. This sets up more potential movement than normal.

2015-08-28_12-43-36

When IV is this much of a premium over realized volatility that usually means the market has imploded, yet we are back to the levels we were at on Friday for SPX. The ground is still very shaky. If anything at this point I would still buy Gamma near the money and sell some Vega out of the money, We could buy ratio call spreads (buy 2 sell 1) with the long calls near the money. Any positive ratio that brings a credit in the some of the Mtl/Miners seems reasonable. If the recovery continues they should pay. BTU has been in the news recently and would not make a bad candidate for this kind of move. Other miners look ok in the space and might do as well if Coal looks too scary,

OptionVision™ – data from ORATS

Read more from Andrew at Option Pit
Friday, July 24, 2015

Aqumin Volatility Newsletter 07/24/2015 - $XME, $XOP, $XLE, $LNCO

Is inflation dead?

Equity prices are very near all-time highs with the help of financials and technology this week. What is conspicuous by its absence are the commodity names. Oil, natural gas, iron and anything remotely close to those industries are deteriorating at a rate we have not seen in a while.

Below I have arranged the OptionVision™ Landscape by realized volatility. The “parking lots” in the foreground are the big 3 sectors for commodities and the realized volatility is racing up with the names putting 1 week lows. Usually declining prices in rising volatility is a capitulation of sorts. I don’t know when this will end, but these names have been taken to the woodshed and then some with oil hovering in the $50s.

2015-07-24_8-50-58

It is true that gold is putting in multi-year lows and all of this has the look of a stampede out of these names. Note that Treasuries have been rising even as the Fed talks up rates. Somebody thinks commodities are dead and leaving in a hurry. I don’t deny the price action, but when I see so much one -sided action in these landscapes it usually does not last forever. The best idea is to own calls and puts in bigger commodity ETFs (XLE, XOP, XME) and trade the deltas as they come.

Disclosure: positions in commodity ETFs.

OptionVision™ – data from ORATS

Read more from Andrew at Option Pit

Sunday, June 21, 2015

Aqumin Volatility Newsletter – 6-22-15 $SPY

Bidding up the Weekend

Greece once again takes center stage as the EU and ECB get fed up with non-compliance out of their Mediterranean neighbor. The huge rallies one day are replaced with the disappointment the next locally. For the first time in a while VIX is going up into the weekend. While Greece is a drop in the bucket in the global picture GDP-wise, it still has broader implications for the Euro and stability. The equity market hates political instability.

The reality is that IV is up only a bit. Every rally is met with a selloff until Jun 30th when Greece defaults or not. Until then the best play has been to buy dips in volatility.

2015-06-21_16-46-11

The best method for this would be buying just OTM put time spreads in the SPY that sell Jun 26 Weeklys. If history is any guide, we will move a bit but nothing will come of it until the following week.

OptionVision™ – data from ORATS

Read more from Andrew at Option Pit

Wednesday, June 3, 2015

Aqumin Volatility Newsletter 5-29-15 $SPY

Withering Volatility

Try as we might the volatility market cannot hold a real bid. Is there a volatility market you ask? Of course there is, it just depends on where you look. Today the VIX cash was up .63 to 13.92 as stocks sold off about .6 %. That is about normal as VIX will increase when the market falls. The question is there a demand for put options at this level?

If you look at a 3D snap of how volatility is moving the answer is mostly in the near term. We are getting some near term pops in IV per strike, but nothing on the longer end of the curve. Until I see the long end jump I am not going to worry too much.

2015-06-01_9-09-52

Junky GDP numbers after the long winter are becoming a habit and this cycle was no exception. The second quarter will probably be better. With Greece the only real issue in the near term there is not much else to worry about. The Fed and ECB are still driving the boat and they have been known to crush the volatility.

It is not just the VIX, but how the IV moves that matters. Long term changes in IV are more important than short term changes. Using the short term pops in volatility to buy upside broken wing butterflies for credits has been very reliable this year. Keep the terms less than 2 weeks and create the short strike around new all-time highs in the SPX.

OptionVision™ – data from ORATS

Read more from Andrew at Option Pit

Friday, May 1, 2015

Aqumin Volatility Newsletter 05/01/15 - $SDEX $VIX

Rally With Morning Coffee

We have a mild rally this morning and it is not too surprising.  The selling this week was more like someone needed to sell.  Many of the big cap names were slammed, most likely to pay for bond positions that were blowing up.  The short Euro trade must be hurting a lot of folks.  Those folks should want some juice.

2015-05-01_10-00-39

The thing is the skew did not get steeper. Note the volatility surface in OptionVision™. The big bulges in IV were closer to the money and the OTM puts did not rise as fast.

The SDEX is a fairly new skew product, but is a nice indicator for steepness of skew in the 30 day cycle for the 25 delta put.  The general range is 71 for a steep skew to 61 for a flat skew.  Today the SDEX tanked to 63.31 down 1.46.  What does this mean?  Put owners were taking profits and the ATM option got bid.  Traders are looking for a move from the money not a crash to the OTM. We are getting that move this morning.

The skew should steepen again as we rally if the ATM starts to decline (rally mode). Upside call butterflies in the big indexes will look good.

OptionVision™ – data from ORATS

Read more from Andrew at Option Pit
Tuesday, April 7, 2015

Aqumin Volatility Newsletter 4/7/2015 $VIX $SPY

ATM IV melts up

Market volatility took a bit of a ride yesterday as the pre-open smack led to, what else, a rally. We got some Fed Governor news on blaming the winter but I feel like the lame jobs report was set up on Wednesday’s ADP number. $50 per barrel oil is not creating any jobs in that sector either. The pre-open action lately has not been a very good indicator of what is going to happen during the trading day.

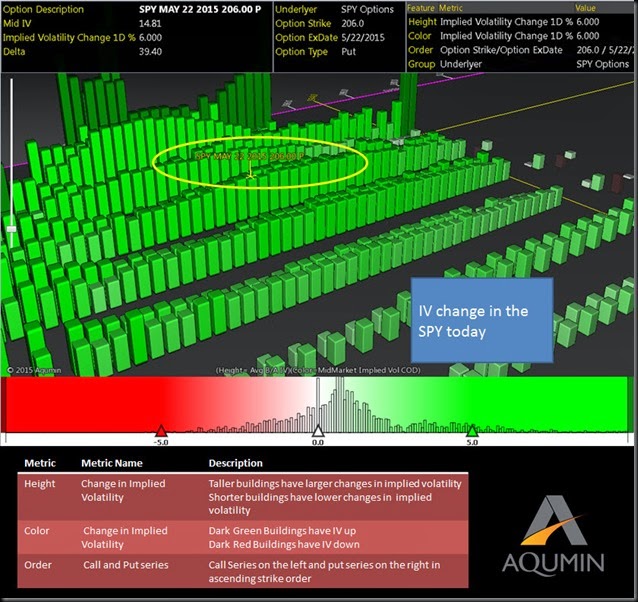
If you look at the OptionVision volatility landscape in the SPY, IV was up per strike today even with the VIX up only .07. I expect some weekend effect but the bulge in the ATM volatility is usually a little telling. Note the slope of the yellow lines sloping up to the ATM. The demand for OTM puts declined today relative to the nearer the money volatility. Market players are expecting some movement but not a ton, what I refer to as “orbiting”. This generates day to day realized volatility but we really go nowhere. It was almost as if this rally deflated the skew a bit which is not really normal.

4-7-2015 9-25-10 AM

That leads to some upside volatility and ratio spreading again looks good. The OTM call condor or broken wing call butterflies for credits in the bigger indexes seem like the right idea. Keep the duration shorter. Place the short strike above the recent all-time highs since the bulge in ATM IV tells us the orbiting market is not finished yet.

OptionVision™ – data from ORATS

Read more from Andrew at Option Pit

Monday, March 16, 2015

Aqumin Volatility Newsletter 3-16-15 $VIX $SPY $SDEX

Move in VIX lacked punch

The IEA came out and said the bounce in oil was only temporary. That caught a lot of the oil market by surprise as many producers and drillers found new lows today. Now we are dealing with a short term, could be long term, gut in oil supplies as OPEC puts the squeeze on competitors. That was enough to foil the bank rally Thursday. The sell-off was half-hearted at best from a volatility point of view.

Note how the IV in the SPY closed Friday. Much of the downside IV actually showed red today. That means that per strike volatility declined on a day when VIX was actually up. Another way to put it was that skew flattened on a down day in stocks.

3-16-2015 10-15-42 AM

If you look at SDEX, which is a volatility index that measures 30 day IV on the ATM and 25 delta put options, it had a drop of .56 to 61.04. The SDEX is running in the same directions as the per strike IV, which it should. The general trend, when skew gets pretty flat and with IV in a middle tier, we should see a rally in stocks at some point.  Usually that rally will give us a further drop in IV.

A decent idea would be to sell iron condors 60 days out into this. Stick with the bigger indexes and keep the delta flat since there is usually a bit of a lag.

OptionVision™ – data from ORATS

Read more from Andrew at Option Pit
Thursday, March 5, 2015

Aqumin Volatility Newsletter 03/04/2015 $XOM $VIX

The Oil Rout Looks Like It Is Slowing Down

This was a strange day in the market when stocks really lacked a sense of direction. For the most part the tone was down and VIX was up slightly, but the volatility futures actually finished down on the day into the close. There was really a lack of interest more than anything else as the race to NASDAQ 5000 left everyone with an empty feeling.

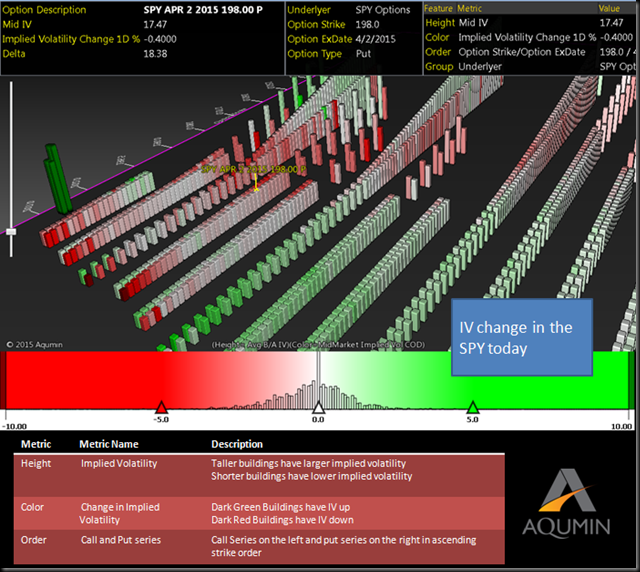
The blighted oil patch seems to have hit a short term bottom. If it isn’t the bottom in prices it is the bottom in realized volatility. Note the OptionVision™ landscape set up where the Oil and Gas producers are in the foreground. Currently they lead the pack in the sector for the biggest average drop in HV10. Granted that was from a very high level, but volatility has to drop for a sector to stabilize, and we are starting to see that.

3-05-15

The sea of red is just 10 day realized volatility trading below the 20 day realized volatility. The oil and gas sector is leading that average decline in realized vol.

I think this group is ripe for selling put spreads and short vega type trades. Oil prices can stay low for a while so pick names that are less leveraged. I have XOM highlighted as a short volatility candidate, but any name in the XLE or XOP ETF’s would do. If you decide to sell a basket of put spreads, working 10% OTM in the individual names, a downside butterfly in the XLE or XOP should hedge.

OptionVision™ – data from ORATS

Read more from Andrew at Option Pit

Friday, February 20, 2015

Aqumin Volatility Newsletter 02-20-2015 $SPY

A Reversal of Risk

It looks like the Greek Drama happening overseas ended up being a comedy more than a tragedy. That is good for investors and good for the Greeks. We will revisit the issue in June but for now that looks like the only thing that was holding up implied volatility.

The OptionVision™ landscape shows an interesting pattern for change in the term structure in the SPY. Essentially the back month terms are dropping in response to the ECB/Greek news but the near term upside is catching a slight bit. This means market participants are looking for IV to drop in the long term but are still wary of a move to the upside in the short term.

2-20-2015 3-14-36 PM

I don’t blame them. Stocks have had the wind at their back since the low rate regime set in around 2009. The slowness in Europe gave the Fed a reason to wait on the rate hikes and stocks will love that. That is what the end of day term structure says today. Index Iron condors look like the rage again since most of the news is out. Go 60 days out to catch the last gasp of volatility in the market but keep the deltas flat.

OptionVision™ – data from ORATS

Read more from Andrew at Option Pit

Monday, February 2, 2015

Aqumin Volatility Newsletter 02/02/2015 - $SPY $SPX $VXX

Orbiting Volatility

Stocks ended the week in an ugly fashion with the SPX down about 1.25%. There was enough in the bad sentiment train with Greece, Euro Area deflation, poor GDP and Russia annexing another part of the Ukraine. Not the stuff of rising markets with earnings only tepid this season. So far most companies that are reporting are doing better than estimates. Not 80% to blow it out but just ok.

Note the OptionVision™ IV landscape from Friday. There is not a hint of skew shift anywhere in the picture. Implied volatility is up across the board but the skew curve in the SPX did not change much. To me that is more of a signal of higher “orbiting volatility” than outright crash time. If traders were worried about a crash they would be bidding up the skew. After Friday there is a bid for near, at and out of the money options.

2-2-2015 8-33-51 AM

The persistent realized volatility is coming from two places: most things happening in the USA are good and near everything in Europe is bad. That gives us the 1% rallies and the 1% selloffs. The Greek pullout means the selloffs will be a bit more frequent than the rallies until there is a settlement, whatever that might be.

The trade is buy the dips in IV using a product like VXX. Use near the money time spreads for the high positive theta and keep the long month in March since it will cover the Greek negotiations. I think any time spread that buys March will pay to some degree as long as you can manage the gamma.

OptionVision™ – data from ORATS

Read more from Andrew at Option Pit

Friday, January 16, 2015

Aqumin Volatility Newsletter 01/16/2015 $XHB $KBH

More Volatility for Homebuilders

We are finishing a volatile week for global markets and it most likely will stay that way until the ECB comes up with some announcement on Jan 22nd and/or the Greeks decide to elect a new government by the end of the month. Earnings reports so far have been mediocre and without the promise of domestic QE, stocks have not been able to recover. Short term, things will stay choppy.

1-16-2015 7-50-38 AM

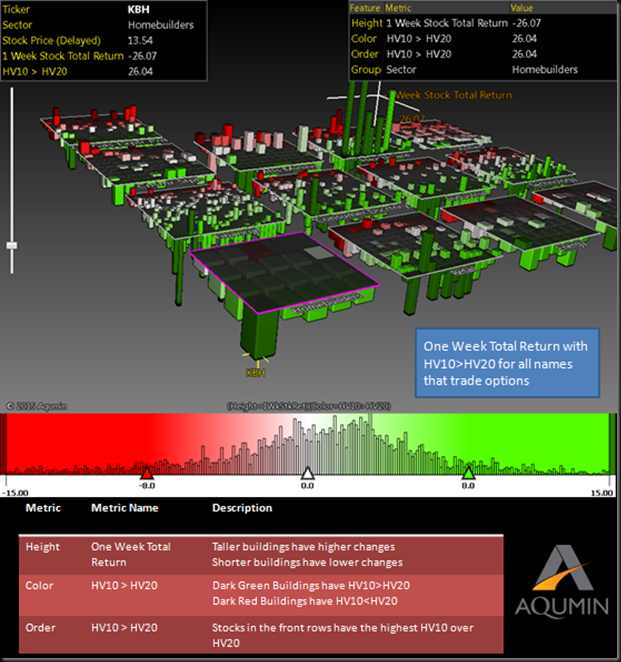
Once again I have Homebuilders leading the realized volatility averages (foreground). Oil and Gas Explorers and Producers are showing the largest relative decrease in realized volatility (back left corner). I don’t know if this is the end of the drop in oil prices but at least it is decelerating. The group even had a few stocks up on the week which is a nice showing relative to the S&P 500. The group is worth keeping an eye on now but I don’t expect any grand bounce.

Rates in the USA continue to tick down. Why? It seems we are the only one of the big 3 tradable economies in the West that are bothering to pay interest. Germany and Japan are at or near 0. That should be good for housing as current reports have huge numbers of home refinancings.

A trade that could work would be to take advantage of KB Home (KBH) crush and sell a just in the money put since this name has already led the Homebuilders down. Hedge with buying a put of same duration, but less money, in the Homebuilder ETF (XHB).

With volatility so high everywhere one needs to be careful. The last time we had Homebuilders leading in relative RV it made a power move up. Past performance does not guarantee future results, thus the slight hedge given our ugly market.

OptionVision™ – data from ORATS

Read more from Andrew at Option Pit
Friday, January 9, 2015

Aqumin Volatility Newsletter 01/09/2015 $SPY $SPX $VIX

No oomph to the selloff

2015 is starting off as the year of many swings. For all the big daily moves in 2015, equities have not really gotten anywhere. The post-FOMC rallies are fueled by the notion of lower rates and we run. Then the sad realization of why we need lower rates hits and we sell off. The only think I can say for this year is that the swings are solid and VIX is off the basement floor.

Even on a down day stocks cannot muster up a big move in volatility. Why? I have VIX up .42 as I write this as stocks are down around ¾%. That is an underwhelming move for VIX as it should pop around 7% for every 1% drop in SPX. Note in the OptionVision™ Volatility Landscape that the only options that have a jump in IV are some upside calls in the near term. The sea of red is a decline in strike IV across the SPY. VIX up but IV down per strike is always curious.

1-9-2015 1-50-53 PM

There is not a lot of heft to the selloff, if we use volatility as an indicator. VIX got near even for the day at some point. The reason being is that VIX is already pricing 1% daily moves. If they don’t come for the downside, I expect we will bounce next week. There is some weekend effect holding down VIX but usually worry will overtake the decay factor. The trades I like have been upside flies in the indexes, say SPX, with a junk protect put just in case.

OptionVision™ – data from ORATS

Read more from Andrew at Option Pit