Monday, December 31, 2012

Aqumin Volatility Newsletter 12/31/2012 - $SPY, $TLT

Buying the big move

The last post of 2012 is a little bitter sweet. Overall a good year for equity returns but I can’t shake the feeling that we missed something and the market is holding back. Most of the big issues of 2012 are not on the front page anymore. Much like the end of 2011, a few loose ends are hanging around. One thing I find telling is that the bond prices (measuring by the TLT) did not continue their move to outpace equities. The Fed is going to keep buying but that rally looks like it is coming to an end. The most crowded trade of 2012 is ending up around nowhere as I have TLT up around 1% YTD before dividends. Here is my last snap of equity volatility going into 2013.

This was the snap for Thursday afternoon in OptionVision™. Note the green bulge in higher implied volatility around the 3rd-5th weeks in the SPY. The two near terms months were expiring on Dec 28th and Dec 31st (today) were red signaling no real movement until after today. The market was and is still hungry for short term options but only after the deadline. That is how tight things are handicapped right now. We are at the strange place where the market is not moving much now but is expecting a big move in the not too distant future. Volatility players are betting that the result of the Fiscal Cliff talks will see a big move. I don’t disagree with them.

12-31-2012 11-51-12 AM

There is a trader saying that ‘volatility begets volatility’. In this case the market is so focused on short term options that I think a large move is inevitable. For me the best play there is to buy the 1st out of the money strangles (closest to the at the money) in options with 2 weeks or less to expiration and then, here is the hard part - hold them. If 2013 starts like 2012 did, implied volatility should move lower but the market sharply higher. The gamma will pay for the volatility drop. The strangle should give you the choice just in case the politicians do not take this opportunity to save us at the last minute.

OptionVision™ – data from ORATS

Read more from Andrew at Option Pit

Thursday, December 20, 2012

Aqumin Volatility Newsletter - December 20, 2012 $SPY, $VIX

Skew Vision

One of most quoted indexes in the financial industry is the VIX. It is also the most misunderstood. How so? The reality is most participants do not understand what the makeup of the product is. Yesterday the VIX spiked to 17.46 just before the close. I know readers of this blog will say the deficit talks stalled and they would be right. Now what did paper actually do? Let’s unpack what caused it.

What I find interesting is how the buying played out. Normally when you see a spike in IV and a market heading south, the paper is flying to the OTM puts. That steepens the skew curve on the downside. What we had today was something a little different. What you see in a 3D curve graph below is that the upside today started to pick up more of a bid.

Looking at the highlighted area of the upside calls in the SPY on my OptionVision™ landscape, you see they were up 5% or more (dark green). You say big deal, but in the land of skew those options were moving more than their put counterparts. Relative moves are important when looking at index skew and when the upside starts to outperform the downside on a big IV move, paper is buying calls or at least that is where the worry shifts.

12-20-2012 9-26-21 AM

The market is having a hard time pricing the gamma (a big up move possibly) with the vega (the attendant volatility crush). Paper just started buying calls and liquidity providers stiffened the upside skew. That is what I am going with because that is what I see. If you don’t believe the market thinks volatility is headed lower just look at the Jan VIX future. Day one on the job as the spot month and it went backward with the full term ahead of it. Not exactly a rousing bid for juice.

Use dip in the market and pop in upside skew for either Iron Condors or long calls spreads in the major indexes. Maybe Christmas comes early this year.

OptionVision™ – data from ORATS

Read more from Andrew at Option Pit

Friday, December 14, 2012

Aqumin Volatility Newsletter 12/14/2012 $AAPL

AAPL vol is through the roof

As I watch the market this morning most of the volatility is coming from AAPL. Traders still cannot get past the fact that AAPL has changed into a slightly different stock lately. 10 Day realized volatility in AAPL is hovering around the 40% level, and as of today the stock is showing no signs of giving that up. Implied volatility in AAPL, measured by the AAPL VIX (VXAPL) is up 3 full points this morning. If you want to see where all the buying is located, take a look below.

The OptionVision™ landscape helps identify how the skew is changing in AAPL. Most of the upside calls have been getting the action. The OTM calls are actually increasing in volatility faster than the OTM puts. If you look below the dark green strikes are up 10% or more. Note all of the dark green increases on the calls are pushing the skew almost parabolic on the upside.

12-14-2012 11-11-01 AM

As AAPL dances around the $512 level, buys are still bidding up calls as the legions of AAPL believers come in and play the next bounce. AAPL could well bounce and most likely will be the beneficiary of any progress on debt talks. If you must get long selling OTM put spreads (475 level) make more sense if the IV starts to cool. Take your time in entering since the stock is still moving around a bit.

OptionVision™ – data from ORATS

Read more from Andrew at Option Pit

Friday, December 7, 2012

Aqumin Volatility Newsletter 12/7/2012 - $XHB, $HOV

Leaving the Homebuilders Behind

One of the strange observations of this past week is how much the market has gone nowhere. We closed around 142 on the SPY last Friday and we most likely will close around 142 today. The recent unemployment report was ok but has some noise in it from Sandy. The casual market observer would think not much happened. However, there are some interesting things going on…

Look at the Big View landscape from OptionVision™. While there was a lot of scattered weekly activity the only real “parking lot” you see is in the homebuilder sector for 1 Week Total Return. I use the term parking lot to describe a landscape sector that has no buildings up for the week. The homebuilders did not participate in the scattered buying and were losing some momentum after their recent runup.

12-7-2012 9-24-20 AM

So, let’s flip over the landscape (below) and see what is there. HOV is a standout with the most pull back of the homebuilders. The landscape color is pretty evenly split between red and green although the green stocks are a little heavy. Color here is the IV30 trading a premium (green) to HV60. Right now IV is probably a little high over all but not too much based on current movement. I have seen this landscape 90% green before and 90% red before over the past year.

12-7-2012 9-34-00 AM

As far as the homebuilders, this is a group that most likely has some big profit taking into the end of the year as the group has performed very well this year. I expect the move up to restart as soon as everyone is done grabbing their cheapy capital gains rates for 2012. The XHB (SPDR Homebuilders Index) has seen $24 once in the last 3 months (it is up from 17.15 at the start of the year) and that is a pretty good level to sell a few puts. Eventually things might start to move again….

OptionVision™ – data from ORATS

Read more from Andrew at Option Pit

Friday, November 30, 2012

Aqumin Volatility Newsletter – November 30, 2012 – $FB, $ZNGA

Two Socialites Divorce

If you are tired like I am of hearing about the weekly saga of what passes for government on Capitol Hill, there is always headline financial news to come back to. The volatility market is locked in a day trade of who says what and when with regards to the debt and deficit so that pretty much kills any trending volatility trade. One stock that has been on a tear recently is Facebook (FB) and the opposite trajectory is Zynga (ZNGA).

FB, I think is, going to continue to run. The volatility is cheap in there and buying calls seems like the easy trade. ZNGA is getting interesting because it is trading for just a shade over its cash on hand. Also note the activity today, fresh on the news that ZNGA will be just like any other game at FB. Namely the two companies appear to be severing their special relationship. Maybe ZNGA will be free to pursue other options in the Social Network space. That news did cause things to shake a bit. Implied Volatility jumped about 15% ATM in both Jan and Mar on the news with options trading twice the 20 day average volume per strike.

11-30-2012 2-43-39 PM

This OptionVision™ View shows mostly active call buying meaning, while the stock might be down a .1 on the news, paper is buying calls betting on a ride up. Sometime a stock does not move much but the options move a lot. I think I would just sell the OTM puts down at this level. On this occasion I think divorce might be a good thing. At least the call buyers think so.

OptionVision™ – data from ORATS

Read more from Andrew at Option Pit

Wednesday, November 21, 2012

Aqumin Volatility Newsletter 11/21/2012 - $SKEW, $SPX, $SPY

When will the skew revert?

One of the most glaring, unremarked pricing events last week was how flat the SPX skew was on the ride down from 1400 on the index. I actually had the CBOE skew index (SKEW) down around the absolute lows of the year. Essentially the skew in an option product is the degree to which the implied volatility in the out of the money (OTM) options differ from the at the money (ATM) implied volatility. There have been books written and plenty of money spent on divining the moves in the index skew “curve”. If you trade volatility products it behooves you to understand how the curve works. Let’s take a new view from OptionVision™.

The first thing to note is the buildings are higher as the columns move farther away. That is the implied volatility increasing down to the OTM puts. The ITM calls are on the left and provide less reliable readings because the bid/ask spread is wider. The view is showing index skew rising (green) in December relative to the ATM. Most of the Dec put protection was sold out last week and the curve is climbing in its natural fashion. Note the later terms just after the Dec ordinaries, the skew is still declining a touch relative to the ATM. Darker red is a steeper decline. Some Jan downside put sellers are still active.

11-21-2012 9-03-58 AM

The reason the later months are still lower is that puts are still for sale. The news says progress and paper is unloading their puts. For the market that is a healthier sign for some higher prices short term. Having paper start to take profits in long put positions I think is slightly bullish. Now we need the politicians to tie up their ends.

OptionVision™ – data from ORATS

Read more from Andrew at Option Pit

Wednesday, November 14, 2012

Aqumin Volatility Newsletter 11/14/2012 - $VIX

Digging into the VIX

There is nothing like a presidential news conference to start a market selloff. Anyone looking for a quick way out of the budget standoff was sorely mistaken this afternoon. I can be hopeful that a simple solution will work its way out but the rhetorical levers are coming out and the market does not like what it sees. Right before the President’s post-election news conference the market was showing us an interesting look at the change in index skew and I thought it instructive to take a look at it.

For this view I am using the newly launched product from Aqumin and ORATS called OptionVision™. The view here is all of the options in the SPY. Note how the volatility was down all along the curve this morning. The taller strikes are the more OTM puts in the SPY. Note the slightly darker shade of red. The call strikes are on the left side of each column and they were of a lighter shade of red even moving to some green (up on the day). Prior to the press conference downside skew was flattening out relative to other strikes.

11-14-2012 4-58-40 PM

By late afternoon IV turned up but let see how it looks.


11-14-2012 4-59-27 PM

With the SPY down around 1.13% as I write this the VIX has to go up. As they calculate the index it is pretty much assured and there is a lot more green then there was before. However the same pattern is persisting. The Jan downside skew is still down on the day and upside calls are even more bid as the market tanks. That the Dec volatility is up is indicative of the wrangling that is going to go on before the first. The recent announcements today did not help that much.

To trade this since the skew is so flat it would be better to buy 2 OTM puts and sell 1 more ATM put in the major indexes and take a nice credit. That way a jump in either direction will help set the position up to win regardless of how long the political haggling takes.

OptionVision™ – data from ORATS

Read more from Andrew at Option Pit

Friday, November 9, 2012

Aqumin Volatility Newsletter 11/09/2012 $SPX

Are we jumping off the Fiscal Cliff?

I marvel at the market’s ability to parse political activity. My own personal adage is that only a government can make a country broke and a market collapse at the same time. That takes a special kind of decision making from the top and the stock market this week knows it. The market hates uncertainty and having both parties (both were voted back in mind you) potentially draw lines in the sand unnerved traders. Surprise, surprise when both guys (Obama and Boehner) came out looking for a solution (Obama slightly less so since he was the big winner). How did the markets react?

No doubt the collapse this week was fierce. What was funny is that most of it was priced in. The VIX was priced at 18.27 before the election and as I write this it was slightly less, so at 18.13 now. If you look in the OptionVision™ landscape view below of the SPX, today there is a small shakeout in the volatility per strike. For whatever reason today the big players took just a small haircut on the volatility.

11-9-2012 2-16-45 PM

Maybe the President gets a bi-partisan solution or not. The market today said they took a small step forward. Until I see the volatility really decline I don’t believe either side. What the market does want is answers and the Fiscal Cliff, however unpalatable, is a spending and taxing answer which folks can budget. From a trade point of view, I would avoid short ATM gamma too much and focus on selling more OTM (way OTM) call and put spreads in the indexes. The problem with government wrangling is that it takes time and is not kind to long gamma positions. Not that we cannot have big moves, but I don’t want to depend on them either with volatility at this level.

OptionVision™ – data from ORATS

Read more from Andrew at Option Pit

Monday, November 5, 2012

Aqumin Volatility Newsletter 11/05/2012 - $F, $GM

Will the market get the lead out?

Usually on Fridays when the closing sentiment feels awful (or great) I like to take a simple snapshot of the week’s activity to get a good sense of how the market did. By the close I felt things were starting to get unhinged for no real reason. Granted, the US election and the Greek election (austerity budget or not) is setting us up for another binomial event in what has become the monthly roll of the dice on big political votes. Those events have set up some nice opportunities as the volatility subsides after the news.

I set up the AlphaVision™ for Bloomberg landscape below and I am looking at 1 Week Return for all optionable stocks listed on the CBOE. Note a good chunk of the market did ok last week. Things felt so bad because the $700 Ipad Mini rally did not materialize as fast as everyone wanted. Overall the US economic news was very positive but the specter of the unknown seeped into the cracks. Look at two of better percentage gainers, GM and F last week.

11-5-2012 9-47-47 AM

Normally I would look at the car companies and say no way, but things are getting better there. Actually as I picked through the landscape most of the stocks that have been decimated by the 2008 Financial Crisis did pretty well last week. The type of trade I like for a low volatility stock like a GM or F is the risk reversal (long out of the money call and short out of the money put) for a credit. The difference is start on the short put side first, since I feel the volatility will come in and leg into the long call side if the market catches a bid. No sense rushing into things until the election, and if the rally ensues, the short put should work fine. Ohio might end up making the big difference in the election but these two companies should keep their trajectories moving forward no matter who wins.

AlphaVision™ – data from Bloomberg

Read more from Andrew at Option Pit

Friday, October 26, 2012

Aqumin Volatility Newsletter 10/26/2012 – $SPY

Can Volatility leak oil?

Fans of the Aqumin blog know I am a big watcher of market volatility. Volatility is the easiest way to judge sentiment in the market because liquidity providers are responding to the option paper (in the old days anyway) thrown their way. Yesterday going into AAPL and AMZN earnings (both were not bad but not great either) the market for volatility was starting to feel heavy. Even with the VIX about unchanged yesterday volatility started to drift in a bit.

Here is a snap from OptionVision™, a joint offering from Aqumin and ORATS that will be released at the FIA Conference in Chicago next week. I have the view inverted so the sliding volatilities show up on top. The big red spikey volatility per strike is in the way out of the money puts and really only represents a .01 or two tick in market width. Look at the breadth of volatility, the columns of red buildings showing volatility dropping across full months. Watching this live yesterday, you would have seen volatility sliding solidly for most of the day. This kind of strike by strike granularity helps me when I want to jump on a volatility trend.

10-26-2012 9-09-40 AM

Will the trend continue? With GDP coming out ok I can make a case for weaker (lower volatility) through the week and premium drips out. The market looks like it really does not want to go anywhere. As long as Spain refuses bailout money I think the upside is muted. Trades that focus on controlled short gamma will probably work best. Either way I will be keeping my eyes on how the volatility moves, tick by tick.

OptionVision™ – data from ORATS

Read more from Andrew at Option Pit

Thursday, October 18, 2012

Aqumin Volatility Newsletter 10/18/2012 $AAPL

Are the AAPL options telling us something?

The market has settled into a pattern of movement lately of a little down followed by a little up. Most of the index skew has been steep lately so market volatility seems expensive relative to the actual moves we are getting. Not so really in the earnings stocks. The moves right now have been of pretty good size in the bigger names (IBM comes to mind). I thought it might be a good time to examine some relative skew in another big name.

AAPL is closing in on earnings next week and the implied volatility is relatively elevated. What looks a little different than normal is how the skew relates in all the months. Normally, AAPL has a bit more elevated IV in the OTM options due to all of the customer interest. Early this week, right now the upside is trading relatively cheap. Note all the green strikes below in my OptionVision™ landscape. That indicates that the OTM options are a little cheaper relative to the ATM options. Most likely the move down from 700 has something to do with that. The red options below show that the ATM options are more expensive than their OTM counter parts.

10-18-2012 8-36-25 AM

What might work as a trade into earnings ? If the upside is trading cheaper, an OTM butterfly position with about 40-50 points between the strikes would be a nice way to buy some discounted deltas into earnings.  Normally when the ATMs are a bit more expensive, paper is planning on a big move. For the AAPL heads out there, this might be a nice ride through the cycle and you don’t have to pay as much as usual.

OptionVision™ – data from ORATS

Read more from Andrew at Option Pit

Monday, October 15, 2012

Aqumin Volatility Newsletter 10/15/2012 $WFC, $JPM

Lonely at the Top

This was yet another day last week when the economic news was ok (earnings were not too bad) but the market found a way to sell off a little. In reality it seems that good news is not good enough. Consumer sentiment has the highest reading today in years and the market still sold off. After the steady pabulum of Central Bank easy and liquidity injections the Algo guys have no reason to jump in and buy stocks. The old fashioned fundamentals are starting to come back into play.

Take the Wells Fargo (WFC) earnings report. Lower margins but higher profits reported, and the stock could not find a solid bid until the middle of the day. WFC is the lone red block in the lower left hand corner of my AlphaVision™ for Bloomberg screen, which means it is the # 1 market cap stock for the financial sector for the stocks I cover here (all the CBOE option listed names). This is the VWAP screen that shows me what part of the market is picking up momentum. Actually WFC got a little stronger as the day wore on (up means trading above VWAP).

10-15-2012 8-05-55 AM

Trade wise I think the bank got over sold (with JPM), as the results were not as bad as the dire thoughts on this earnings cycle might suggest. I also like when the market is relatively weak, that I see some momentum come back into the name. For me it makes a nice time spread to ride out the rest of the earnings season. Buy a back month out of the money call, sell a front month out of the money call and let the movement go to the strike. At some point someone with some money will figure out this cycle is not as bad as the pundits would have us believe.

AlphaVision™ – data from Bloomberg

Read more from Andrew at Option Pit

Wednesday, October 3, 2012

Aqumin Volatility Newsletter 10/03/2012 - $RIMM

Is RIMM the new IBM?

Way back in the early 1990’s when MSFT was beginning its climb to dominance IBM was on its way to 0. It is hard to believe but at the time the mainframe business of IBM was going away due to the fantastic growth of the PC and mini computers. As a trader looking at the IBM pit I could see the every call strike going out worthless as the pit was selling every call that could find a bid. I think split adjusted the IBM hit $10 bucks or so (now trading north of $200). This is not an article about IBM but really one of a turnaround possibility. Companies, even ones where the prospects look bleak, can turn it around.

Imagine my surprise yesterday when my AlphaVision™ for Bloomberg ticker landscape (in real time) showed RIMM of all names strongly up in an otherwise very weak market, and super weak for the big techs. If you note the layout of my screen, I follow all listed names that trade options for equities and ETF’s in this landscape. This is a screen I euphemistically call my “looking for stuff” screen. While RIMM is not the big cap stock of the 2008 glory days some money finally is coming back to the name after a better than anticipated earnings report. This is the first time RIMM has been able to sustain some upside momentum after earnings for at least a year. That is a good sign for bulls.

10-3-2012 11-46-47 AM

Will RIMM become the next 20 bagger like IBM in the early 90’s? Really too early to tell, but the implied volatility is in the 60’s, and for an $8 stock that is cheap enough to day trade the dips by buying ATM calls (which I have been doing) since there appears to be nice support down here. Even buying some calls going out on the cycle is not such a bad idea. After all, the competition is pretty fierce in the computer industry too and IBM figured it out. You never know but the options are cheap enough to give it a go.

AlphaVision™ – data from Bloomberg

Read more from Andrew at Option Pit

Friday, September 28, 2012

Aqumin Volatility Newsletter 09/28/2012 - $AAPL, $GOOG

When the leaders don’t lead - look at the volatility

My catchy title does not mean our illustrious politicians of course (although the Euro lot seems to be getting a bit more on the ball) but watching the market trade intraday. The market had a decent reversal by the announcement of the Spanish stress tests, but as of this writing on the close not much more has materialized at this quarter end.

If you note the real time VWAP landscape in AlphaVision™ for Bloomberg, the big cap market leaders in technology (GOOG and AAPL) suffered all day to find a bid. The fact that they are red in the landscape means the stock is down on the day. The names under the horizon are trading below their value weighted average price for the day. Buildings that are red and pointing down mean stocks with a very low relative strength on the day. Not even a quarter end mark up could help.

9-28-2012 3-35-51 PM

As this season ends, the big rally the market had went out with a whimper. The sell off today was mostly the big names running out of gas but generated a nice little rally in the volatility. Monday (three days from now) will end up being the volatility sale for the week as the market looks for some new traction and continues sideways now that more Euro news is out (again, it was not awful). Make sure to close the short volatility positions ahead of NFP just in case.

AlphaVision™ – data from Bloomberg

Read more from Andrew at Option Pit

Tuesday, September 18, 2012

Aqumin Volatility Newsletter 09/18/2012 $NUGT

Golden Times Ahead

This week is already feeling like zip is going to happen. No real volume, no real announcements and just a general lack of enthusiasm. Back in late June, I remarked on how listless gold had become (see the post from June 26th). And in fact the product I referred to, NUGT, hung around the 10 handle for the next two months. Things are a little different lately.

As you can see from the AlphaVision™ for Bloomberg realized volatility landscape below, NUGT was the equity ETF standout over the last week. As a matter of fact, most stocks did pretty well except for the volatility products. In this realized volatility landscape, the green stocks have short term realized volatility increasing over the last 30 days. It is not a surprise since the market has had pretty good sized up days in the last 10. Note how most of the market had much higher short term realized volatilities (all the green shown) NUGT by its short term nature is riding the gold miners to some near term highs for the name.

9-18-2012 12-43-30 PM

As in the early summer, most of these levered ETF’s have a hard time maintaining momentum once they race this far up (or down) ahead of everything. I would not be surprised If NUGT lost a little momentum going forward (although I have a hard time fading the gold rally). Maybe a name like NUGT would be best served with an upside trade that is still long but takes in some premium like an ATM butterfly. That should get us to mid-October when the ECB weighs in with yet another decision.

AlphaVision™ – data from Bloomberg

Read more from Andrew at Option Pit

Friday, September 14, 2012

Aqumin Volatility Newsletter 09/14/2012 $NBG, $SPY

Beware Greeks bearing risks

I am watching the rallies of the last few days and all I can think of is Batman. Yes, Batman. I want to say “Holy hat racks Batman this is a big rally!” I like to think of them as melt ups. The markets have been crashing up every time there is a snippet of good news. Clearly Bernanke’s 3rd bond buying escape sent big dough into the markets as we went to year high’s if not multiyear highs. Has there been a shift in risk appetite?

Just creating a realized volatility landscape for the market usually gives me a lot of information. Most of that information (on a macro level) tends to be from what names are showing up. Not even looking for anything and out pops the National Bank of Greece (NBG) on a Total Return basis for the last week and realized volatility basis. NBG was near the top in realized volatility (strength of the move) and tops in percentage gains. While there was heavy short interest in it, the signs that the shorts might be giving up is usually risk subsiding. The only thing holding up index volatility is the violence of the up moves.

9-14-2012 1-06-31 PM

At this point it will pay to be long in the market until the end of the year. Why? Because perception of risk all down the curve is starting to drop. NBG is just one more symbol of a market driven less by fear (now of course it is Fed generated liquidity). Of course the politicians need to step in and do something (cut spending). But I think the Euro collapse fear is down hugely and having shorts cover NBG is just another sign.

A nice trade might be going long index products (like the SPY) and hedge with a ratio put spread in the Oct month (buy 2 out of the money puts and sell one at the money put) for a credit. The reduction of risk makes protection cheaper, and it is better to buy it now when you don’t need it.

AlphaVision™ – data from Bloomberg

Read more from Andrew at Option Pit

Friday, September 7, 2012

Aqumin Volatility Newsletter 09/07/2012 $UXVY $DUST


Are we living in bizarro world?

The plan presented Thursday by Mario Draghi put the market into orbit. 2%+ rallies are great but this one was more a result of short covering than anything else. The ECB will print and the Euro goes up-must be short covering. The NFP data is not so good and the 2% rally of yesterday gets a boost- must be short covering. At least gold was not buying the non-inflation thing as metal rallied to near term highs. What asset is performing the worst this year?

The answer is volatility. See below in the AlphaVision™ for Bloomberg landscape, the UVXY (ProShares Ultra 2x short term VIX futures) was the worst performing (inverse scale) actively traded ETF this last week (10-1 reverse split not withstanding). UVXY made year lows today too. Also the name was showing higher relative (dark green building) 10 day volatility to its own 30 day volatility. The collapse in UVXY has serious velocity, which screams paper wanted out. The only name close was DUST (levered Bearish gold product from Direxion). The market, at least from a volatility standpoint, is calling the Euro crisis over and it just might be.

9-7-2012 2-52-32 PM

My sense of this is that the volatility collapsed after Thursday’s Spanish Bond auction when Draghi basically told the world the ECB is ready to print to save the Euro. I think all the market really cares about is that the Euro holds together, at least in this algo driven age. Stocks are living on a dose of news snippets and yesterday’s was the doozy. I think most of this year’s rally was just the addition of last year’s non performance. After all the 14% the broader market is up is just 7% for last year (basically flat) plus the 7% for this year so this level is reasonable. Without any Euro nonsense, which is mostly freezing up liquidity, we could easily go higher.

Speaking of news, the German High Court will rule on September 12th whether the ECB bond buying scheme is legal. If it is, I think the market is off to the races for the rest of the year as most of the money has been collecting dust in cash, T-bonds and mattresses. Ask the question if you really want to sell volatility into bottom coming into yet another Euro announcement? Maybe buying some volatility of volatility on September 11th (that is a sad coincidence) will help ride out any surprise decision from a Supreme Court. After all, Supreme Court’s are predictable, right?

AlphaVision™ – data from Bloomberg

Read more from Andrew at Option Pit

Friday, August 31, 2012

Aqumin Volatility Newsletter 08/31/12 $VXX

End of the Dog Days of Summer

The Fed rose to the occasion again today and decided to be ready to act. I thought that was a fitting end to August as this month passed relatively quietly, unlike last year. The market got a little rally today along with gold and the Euro. Players are thinking it is better to go home long a little of everything than the other way around. The same can be said of the market implied volatility. For just about all financial assets, the volume is very light, so it’s really tough to gauge any path, but I will try below.

The Option Vision landscape below shows the VXX options. The little spikes are showing above average volume for the option class today. The VXX is trading right at average volume for most of the spikes except for September downside puts and upside calls. The Sep 15 calls are catching a small bid with the volatility up around 3 points. But the Sep 13 calls have the volatility down less than 1 point. The implied volatility in the Sep out of the money puts dropped as well (little red buildings) after the post-Bernanke volatility fire-sale did not really happen.

8-31-2012 2-24-59 PM

Really what we have is the near term movement driven by the European schedule over the next two weeks. The buying is in the upside volatility potential given some Euro surprise as most of the positive US news is swept under the carpet. I think players are just adding to their mix of assets and a little volatility won’t hurt. The calls they are leaning toward would need a big surprise downside move to generate any return. Ultimately though I think they are just hedging all of the other assets they own for the next couple of weeks. And like we have seen most of the last year, all the angst usually ends up being for nothing (with a couple of scary days in between).

OptionVision™ – data from ORATS

Read more from Andrew at Option Pit

Friday, August 24, 2012

Aqumin Volatility Newsletter 08/24/2012 - $BIDU

Bada Bing, Bada BIDU

Most of the headline news this week was showing weaker growth in China. Since I am a believer in relative value, weaker growth in China is well, relative. Either way the Chinese equity markets have been kind of plonky this year. It is just kind of a slow drift down without much pop. When a Chinese stock does have a move, I take notice.

Here in the new Option Vision™ platform with ORATS you can see the strike by strike volatility activity this afternoon in BIDU, a popular Chinese internet stock. Note many of the big green spikes in BIDU per strike. This just shows the name is very active on high volume and slightly increasing volatility. No surprise as it had a $15 range yesterday.

One thing about the colors below is some red in the more out of the money put strikes in September. From yesterday to today some heat came out of the near term, downside options. After a short move down this a.m. with general market softness BIDU came back a bit. That small rally took some implied volatility out of the downside options.

8-24-2012 2-17-37 PM

This is probably a short term buying opportunity in BIDU. The best way to me would be to buy some out of the money call time spreads for low deltas and let the rest of September volatility melt away. With some news on the Greece restructuring coming out in Oct (November is the earning cycle month) the time spread is a smart play to play a bounce.

OptionVision™ – data from ORATS

Read more from Andrew at Option Pit

Friday, August 17, 2012

Aqumin Volatility Newsletter 08/17/2012 - $BAC

Unusual Activity

Today has been a relatively slow day. Quiet, and for the most part the market can’t get behind much except for AAPL which is making new highs. I think with most of the name volatility making year lows and the indexes getting close, it is best to look at what is drawing the market’s attention. The surprise of the day is in finance.

Look at the Relative Volume numbers for Bank of America (BAC) on the OptionVision™ landscape below. The tall buildings just give a graphical representation of how busy the options were relative to normal activity. I actually had this on my radar earlier in the week because the IV had gotten so cheap and the story on BAC is still pretty mixed. Large paper came into the name today and bought calls and sold puts. That was enough to light up some buying as BAC broke through $8 for the first time since July. BAC has yet to make it past $8.25 since the spring. It looks like some paper is betting big that it might happen again.

Buying October volatility in BAC looks very good to me.

8-17-2012 1-39-11 PM

OptionVision™ – data from ORATS

Read more from Andrew at Option Pit

Friday, August 10, 2012

Aqumin Volatility Newsletter 08/10/2012 - $ADM

Fill up the tank or buy a Coke?

As we sit going into the Italian Bond auctions next week, the market is going nowhere fast. The reality of constant intervention promises and no real action is finally dawning on the equity markets. No action, no rally seems to be the sentiment. That does not mean there is nothing going on in other places. Take the drought we have seen this summer as an example.

I have the Option Vision™ screen from Aqumin and ORATS below showing the current Implied Volatilities relative to the ORATS Smooth Volatility Valve (SMV). This shows when a stock skew (relationship of out of the money calls and puts) is out of kilter from a historical norm. The close up below is for a stock I have been watching, ADM. The green buildings are showing higher IV to norms at the money.

8-10-2012 1-20-23 PM

If you zoom out you will notice how ADM stacks up to other names in the sector. Note MNST (the beverage maker) is getting a bit of a volatility squeeze too on the skew with a pending investigation.

8-10-2012 1-21-40 PM

I think the market is looking at ADM with a lot of corn going to ethanol and the other bunch going to corn syrup (think KO). The problem is that ADM is stuck in the middle of the $8 per bushel corn rise and is getting squeezed. As long as the options stay bid, I think more downside is in the cards for the big ag processor.

Note:  Alerts could indicate an option that has been traded and has moved away from the normal volatility relationships as defined by the smooth fit.  Alerts can also indicate groups of options that are trading off the curve for other market reasons.  For example, if the at-the-money options are trading lower than the smooth and the out-of-money are trading higher than the smooth this may indicate that the market is expecting lower volatility in the coming days but not in the longer term where the outs may give protection.

Read more from Andrew at Option Pit

Friday, August 3, 2012

Aqumin Volatility Newsletter 08/03/2012 - $VXX

Withering Volatility

Getting a feel for market volatility is not always easy. Take Thursday’s market activity as an example. The market had a roller coaster ride and ended down 1%. Super Mario basically said nothing in his policy statement that he had not already said before. That pretty much flushed the Euro, Spanish Equities and the US markets (T bond notwithstanding, of course). But getting a deeper read is necessary to see what the market is really thinking. Let’s read the new OptionVision Landscape.

The Landscape is just the VXX Volatility Landscape for yesterday. The dark red in August VXX means the implied volatility was down for most of the strikes in play. I took this snap when the market was actually close to the bottom. You will note the green spike in September (spikes are higher than normal volume). That was a buyer of OTM calls in the VXX in the panic, which was most likely part of a spread trade in the other two spikes surrounding it. Overall the volatility trend was down (note the red on most of the active strikes) and it was down when the market was not acting well.

8-3-2012 8-55-42 AM

If the volatility of a volatility product like the VXX is in the can today, expectations for greater volatility in the near term are pretty low. As a matter of fact I bet the implied volatilities go lower for the next week or so in this August cycle. Now that the market knows Super Mario is willing to step in and buy bonds (maybe) and Big Ben is going to wait for the politicians to get elected, most of the game is out. Welcome to the sideways markets. I bet the VXX trades $12 next week.

Read more from Andrew at Option Pit

Wednesday, July 25, 2012

Aqumin Volatility Newsletter 07/25/2012 - $FXE

Euro Mess

All of the give and take in the current Euro Zone bailout discussions is really putting a damper on the US markets. While we have our own politicians to deal with (not much happening there until mid-November), the never ending crisis in the Euro is becoming a real global drag. England reported shrinking GDP although most of the reason is a reduction in government spending. It is the never ending game of kick the can that hurts global sentiment. I think the Asian governments did a much better job of dealing with the borrowing issues quickly in 1998. These problems will continue to plague our markets until a permanent solution (fiscal compact, that is) is in place.

How to see this? Even on an up day in the Euro (from near term lows), the implied volatility in the FXE is still climbing. Not as much as in the past couple of days - but still climbing. As you can see in the volatility landscape below using OptionVision from Aqumin and ORATS, the green option series means the Implied Volatility is going up. The spikes shown are the strikes that are exhibiting larger than average volume. While the volume was relatively light this morning (when this was snapped) the implied volatility is still going up.

7-25-2012 2-14-54 PMThere is a little more activity in the downside puts in September and some extra call buying in August. The volatility trend is up in the currently fragile currency. The 130 line in the sand for the Dollar to Euro was May 1st and the 125 Dollar to Euro was July 1st. Until some substantial action in the Euro Zone takes place, a more volatile Euro is sure to follow. Last fall’s FXE IV high was in the 17% range versus just 11% today. With Greece unable to keep commitments, Spain not finding buyers of their debt, and no fiscal compact in sight, this volatility is only going higher.

Read more from Andrew at Option Pit

Friday, July 20, 2012

Aqumin Volatility Newsletter 07/20/2011 $EDU

Chinese Takeout (or takedown as the case maybe)

The market might be entering the new post-Euro muddle phase. News today of some Spanish Bank help and bondholder haircuts hit as the markets were just starting to enjoy a lift from better than expected earnings this week. Having bond holders take some pain is the best path to recovery since markets have to stop going down before they go up again. The US housing market is showing the way there. It was painful but necessary. Mostly the markets are going to oscillate between so-so good news and bad news until the elections when the volatility will pick up again. It is time to look at some outlier movement.

Below is the one week momentum landscape I use to look for trending movement in AlphaVision™ for Bloomberg. This landscape shows 1 week total return against the difference between 10 Day Historical Volatility and 30 Day Historical volatility. The clear loser for the week in its group was EDU.

7-20-2012 10-48-00 AM

Several, if not many, US listed Chinese companies have had accounting issues. It might be the Wild West over there when it comes to accounting or maybe the Wild East. Either way with an SEC investigation the shares plummeted and the implied volatility hit the roof, which should put a lid on a share bounce. No doubt there will be a cloud over the company for a while. It looks like a butterfly set up to sell the volatility is not a bad idea while things shake out.

Read more from Andrew at Option Pit

Friday, July 13, 2012

Aqumin Volatility Newsletter 07/13/2012 - $CORN

Head High CORN?

For the most part the market seems kind of listless looking for a direction, even maybe finding one today with the volatility indexes coming in. The Europeans have succeeded in extending their problems for the foreseeable future and the US is waiting for earnings to start coming out. Either way it is a recipe for not much to do as we move into next week. What was moving this week?

As I look at the AlphaVision™ for Bloomberg Landscape I see the stand out activity by monitoring 1 week total returns (how tall the buildings are) and for rising volatility I organize color so the dark green buildings show 30 Day Implied Volatility running over the 60 Day Realized Volatility. The idea being a big move accompanied by a run up in volatility should say something. Most of the health care stocks in the foreground (read biotech and drugs) show these kinds of moves. It gets a bit more interesting when the ETF’s do. Take a look at CORN.

7-13-2012 3-20-12 PM

CORN, when I snapped this on the close, was one of the biggest rallying ETF’s with a large premium in IV30 this week. Usually that means the market, and paper, is piling in. What I thought more interesting is after the crop report CORN (the Teucrium Commodity Trust for Corn) bounced and rallied today. Maybe it has more to go. ATM call spreads in August should do the trick.

Read more from Andrew at Option Pit

Friday, July 6, 2012

Aqumin Volatility Newsletter - 07/06/2012 $NFLX

NFLX streaming to a home near you…

The market is entering into a PTSD (Post Traumatic Stress Disorder) period as it recovers from the near loss of the Euro. It is not over yet, because the politicians love to talk, but the boogie man seems to be back in his cave for a while. Not that all the other news is really great as we wait for the job picture. I do think the good housing news is key. That has been an industry in decline since late 2007 and it might be picking up some jobs finally. Now roughly 5 years later and with qualified buyers at 3.5% mortgages it sure smells like the low. But as traders dip into housing stocks after being burned for 3 years or so, they now jump into another roach motel (“traders check in but they don’t check out”, to paraphrase an ad jingle), NFLX.

But is NFLX going to be the next big roach motel? The way it comes up on my radar is the AlphaVision™ Gap Screen for Bloomberg. I use a difference of 10 Day Historical Volatility and 30 Day Historical Volatility to see which stocks are moving lately. The move in NFLX, as you can see below, was very large relative to the other names in its space and showed very high velocity. The “tallness” means it was up most for the week which rounds out my midterm momentum trends.

7-6-2012 9-18-11 AM

I like to see standout momentum. If NFLX is, like the CEO says, the biggest distributor of online content that is a big deal. The stock was dead in the low 60’s in the fall and now is trading around $81 and change. The run-up before earnings is an ideal time to sell some out of the money put spreads in the July cycle. The name should keep this upward to even flow until they report on July 24, 2012. Usually the off-earnings cycle month experiences some volatility compression which should help the put spreads.

Read more from Andrew at Option Pit

Wednesday, June 27, 2012

Aqumin Volatility Newsletter 06/27/2012 - $NUGT

Muddling for Gold

As the volatility has calmed down some over the last few weeks (calmed, not gone away), it is interesting to note that stocks and gold have come off their recent highs. Seems like we are not hearing much about it but both are slowly losing the momentum we had coming out of the Greek elections. Since nothing was really solved, Spain now says they cannot finance at 7%, the market does not have much to look forward to since the fiscal issues and reforms are what’s needed to add some confidence. Right now that is not happening here or over there. When one of the best performing assets is the US Treasury Bond over the last 10 years, there have been some serious policy foul ups. I do like looking at the leveraged ETF for short term signals when they are a stand out. Look at NUGT below.

NUGT is the 3x Gold Miner Bull ETF. It was also the worst performing ETF over the last week as investors left gold in droves. The AlphaVision™ landscape below is inverted so not much good happened over the last week for long equities. The landscape color is showing increasing (green) and decreasing (red) realized volatility. NUGT as a proxy for gold is a pretty good indicator. The name is declining at a less volatile rate which is probably not good for keeping up the implied volatility. It feels like gold will muddle around here for a bit.

6-27-2012 10-33-08 AM

For now the Treasury bond seems to have replaced gold as the flight to quality instrument. And imminent inflation does not seem around the corner. Short, controlled positions like Iron Condors in the midterm out of the money options with 60/40 payouts might make sense in this one. If the realized volatility continues to fall the implied volatility should follow soon enough.

Authors Note: Leveraged ETF pose substantial risk. Keep any transaction contract neutral and consult your financial advisor before executing.

Read more from Andrew at Option Pit

Thursday, June 21, 2012

Aqumin Volatility Newsletter 06/20/2012 - $VIX, $UVXY, $VIXY, $VXX


When Volatility goes down…

The mini-crash we had over the last month seems to be over (educated guess on my part). First, the market appears to be accepting that the Euro Area will continue to be a mess with lots of wrangling back and forth. Keeping the Euro party going is the goal. That stability is much easier for stocks to handle. Second, the US keeps muddling along with its generous fiscal policy and low interest rates. One or both of those has to change, just ask Greece. Even JPM was able to cover some of their short positions in CDS insurance. Lastly, the market crushed the volatility last week. Take a look at the AlphaVision™ volatility landscape below.

6-21-2012 9-43-52 AM

The Volatility ETN’s went down over the last week, registering some of the lowest total returns in the market of any major exchange trade product (landscape above is flipped (inverted) showing what is down). Note the light colors of both highlighted names (VXX, VIXY and UVXY) in the AlphaVision™ for Bloomberg Landscape. UVXY had a trailing 10 Day Volatility, trading about even with the 30 Day Volatility. Both the VXX and VIXY had slightly higher near term volatilities (light green) but not overly so. To me that means an orderly decline which is better for equity values short term. There is a trading rule that when the VIX breaks 25 on the upside - buy it, and when it breaks 20 on the downside - sell it. This VIX trading rule seems to be holding true since the Greek Elections. I expect it to continue.

Authors note: Trading the volatility ETN’s is very risky and requires a solid understanding of the products’ underlying characteristics. Read more from Andrew or sign up for Option Pit Live at www.OptionPit.com.

Wednesday, June 13, 2012

Aqumin Volatility Newsletter 06/13/2012 - $JPM, $C, $BAC, $BRK, $STD

The Big Banks are moving like hot cakes

As we get into the Greek election weekend there has been plenty of up and down movement going on. The major indexes have been trading at 20%+ realized volatility, as the market trades on each bailout snippet, and finance minister squabble. The market for volatility is still looking very robust, but how long will that last? Look at the financial stocks below in my AlphaVision™ landscape view of 30 Day Realized Volatility. (This is just one of the landscapes we will be running live at SIFMA next week).

What helped turn the heat up on the Financial Sector was JPM’s trading losses. Those losses, while big, are nothing compared to the balance sheet of the company. JPM will most likely recover. The timing of that with the Greek political quagmire turned the mess into a market rout. Now the big financial stocks are swinging again. The Aqumin landscape below shows 30 Day Realized Volatility. The spiky dark green buildings are names with the most underlying volatility for each sector. In the Financials, most of the big money center banks are the most volatile right now. That usually means trouble for the rest of the equity market. The two big blocks in the front are just different classes of Berkshire Hathaway (which generally weathers financial storms well). The banks need to settle to sustain a rally in stocks (not just the flip flop we have had lately).

6-13-2012 10-36-01 AM

The Greek election will (hopefully) provide a clearer picture of whether Greece stays in the Euro or not. I don’t think the ECB and Germany can afford to have a country keep going back on debt pledges. We will see Monday. Either way the steeper underlying action for the big banks can go on indefinitely. Short time spreads (these are big margin for retail) in the banks for the OTM puts should work out when the dust starts to clear. I think the volatility will start to come in and the US banks should catch a bid since they have already survived their own financial crisis.

Read more from Andrew at Option Pit

Friday, June 8, 2012

Aqumin Volatility Newsletter 06/08/2012 - $HOV

Cheaper to Buy than Rent?

With interest rates at or near historic lows, I have to give some credit to the Fed for somehow managing to keep rates low in the face of so much US Government borrowing. The Fed Chairman’s comments this week suggested he is running out of patience (and room) on the stimulus side. The politicians need to make some decisions now both here (fiscal cliff) and abroad (Greek referendum on the Euro). No doubt central bankers will keep one more round in the chamber until they really need it. Until then, we all wait.

Below is my AlphaVision™ landscape view of the 60 Day Historical Volatility and 30 Day Implied volatility. Note how most of the landscape is dark green. I usually see this when the VIX futures are trading 25 and above in the short term. Right now market volatility is pricey reflecting some of the European Debt Issues. The USA housing market is in its 4th year of a down turn. There is not much more downside there, come what may in Europe. Some homebuilders are even starting to make money again.

6-8-2012 10-45-35 AM

Take a look at HOV. There has been a nice bounce in the market this week (for what reason, except selling fatigue, I’m not sure), but the homebuilders are still trading very much at the end of a 5 year range. Use the current market and higher volatility to pick up HOV below $2 by selling August puts. If we get a runner, buy Aug 2.5 calls to create a risk reversal for a credit. As we get past the Greek Elections this week, I think this trade should catch a breeze. By selling the put, traders can rent the long position prior to the good earnings report, and decide to “buy” later.

Read more from Andrew at Option Pit

Tuesday, May 29, 2012

Aqumin Volatility Newsletter 05/29/2012 $NUGT

Is there Gold in them there hills?

Last week began the countdown to the Greek elections and a referendum on whether the Euro holds together in its current form. As of now, I have no idea how it will turn out, except the polls are about even, with the left-wing Syriza party losing some of its early advantage. Maybe the thought of temporary economic collapse, along with tougher talk out of the Euro ministers, is starting to register. The equity market has a taste of what’s to come until mid-June - a little of nowhere punctuated by sheer panic. And then at some point, there will be an answer. Last week’s action was typical.

Below is the AlphaVision™ for Bloomberg Momentum view. Each the names listed on the CBOE (about 3000+) are represented by one of the colored buildings on the landscape. I use a difference of HV10 and HV30 (10 Day Historical Volatility minus 30 Day Historical Volatility) for both color and sorting. Dark green means that volatility is spiking, and tall means that the name is up sharply in price over the past week; I’m looking at tall green spikes. The times I think this really matters is when a name stands out, with few others doing the same in the sector. That shows that some capital was moving in. NUGT (Direxion Daily Gold Miners Bull) was moving out when most ETF’s were relatively flat last week. I don’t trade the levered ETF’s much, but I do watch their movement. Usually when one name really pops in this landscape, when the other names are flat, that name should start to run out of gas. It looks like the Gold Miners are getting there on an old fashion dead cat bounce.

5-29-2012 10-21-20 AM

The Gold Miners are very near the bottom of their range for the year and are showing a healthy bounce. The uncertainty surrounding more macro issues will give these names some support. I don’t think they are a short. Better to sell some controlled downside premium or mid to flat upside that is contract neutral in the Jun cycle. The Greek Elections are June 17th, after expiration, and after that selling gamma will not be on the top of my list.

Read more from Andrew at Option Pit

Thursday, May 24, 2012

Aqumin Volatility Newsletter 05/24/2012 - $AAPL

Peeled back in Apple

The market had a nice reversal yesterday. Over the last couple of days AAPL has generally been leading the market out of the Greece induced doldrums. I don’t think we get into any big rally mode until there is some clarity on the Euro issue (remember the 1st quarter rally?) so for now, market players have to take what they can get.

Look at the strike by strike activity yesterday in AAPL. In the morning, paper was piling into the name in June. Note the high relative volume (spiky green strikes) and pop in volatility when things looked extra ugly in the morning. The OptionVision Landscape gives a nice sense to the bid in volatility in the morning. Will it hold up?

5-24-2012 11-01-01 AM

Now as the day progressed and AAPL started to catch a slight bid the upside volatility started to peel back a bit. Note the upside strikes in the OptionVision Landscape below. The red buildings are showing the hints of implied volatility coming in and this was a good signal to start selling the IV in general in June. While the more ATM contract stayed bid 2% above their opening value, they did drop from about 4% over. Either way, the bid in volatility coming off was a good signal to sell it.

5-24-2012 11-03-06 AM

Watching the volatility flow in action helps create positions. With the higher IV, AAPL is setting up mostly for butterfly type trades and catching a downturn in IV helps add some positive p/l in a hurry.

Read more from Andrew at Option Pit

Thursday, May 17, 2012

Aqumin Volatility Newsletter 05/17/2012 - $HLF

Is Herbalife going to be cut in HLF?

While most of the market teeters on the anticipation of Greek elections in mid-June, there are still events outside of the worry that are fun to watch. As I prefer to see market activity in 3D color, I thought watching the new flow product OptionVision from Aqumin and ORATS (Option Research and Technology Services) would be helpful.

Using OptionVision traders can see intraday option flow for individual equities, indexes and ETF’s. Pretty much anything ORATS already covers. Just type in the name and up pops the Relative Volume and Implied Volatility change for the name you want. Since I was all ready following HLF on the heels of the first Einhorn questions during the HLF earnings, this is a great way to keep on top of the order flow per strike. The name plunged from $70 to $41 last week and I wanted to see if I could get a hint if it was going to rally. I had a time spread pick going in TheStreet’s Option Profits once HLF hit about $42.71.

The screenshot from yesterday shows how the volume was pumping into the upside calls in May. The Option Relative Volume describes how much the current volume on a strike is spiking over the 20 day average for the front 5 months active series. Before the news hit the tape the action got kind of bubbly as you can see. Either way it provided a nice out for the time spread.

5-17-2012 10-13-37 AM

Read more from Andrew at Option Pit

Wednesday, May 9, 2012

Aqumin Volatility Newsletter 05/09/2012 $AVP, $DF

Putting Lipstick on the Pig

I am officially deciding the Euro fiscal problems are a permanent part of the equity markets in the USA. While the USA will no doubt have similar problems if the government fails to act at some point, you would not know it from the strength in Treasury Bonds. The new volatility is nerve racking for equity holders but great for traders, especially if you have a nice way to keep track of the movement intraday. The buy near the open and sell near the close has held out now 3 days in a row. The Euro Banks sell in their session, crushing the USA markets, go home and the sellers leave lifting the broader indexes here. Take a look at the landscape below.

5-9-2012 12-17-25 PM

This is the AV for Bloomberg VWAP Landscape. Buildings that are up on the day are trading ahead of WVAP. When they are red (still down on the day) or green (up on the day) that tells the traders the relative position. The muted white color is very near even so as of this afternoon things look a bit mixed to weak, but not as bad as this morning. The fact that most of the S&P 500 was trading much higher midday than in the morning means the pattern is keeping up. (This landscape was all below the horizon at around 10am ET this morning.)

Some of the bigger names in Health Care and Consumer Staples did not bounce back. I have AVP (Avon Products) highlighted because the deal seems to be back on. The dark green color means that the name is trading strongly near the highs of the day. If Coty is raising money maybe a higher bid is in the works. An option trade that may work is something like a short time spread in the just OTM puts. If you can collect a nice enough premium before the cash buyout you can buy some new lipstick or man cologne for that special someone.

Read more from Andrew at Option Pit

Thursday, May 3, 2012

Aqumin Volatility Newsletter 05/03/2012 - $NFLX, $HRB

NetFlops

Where I was pretty bullish about 6 weeks ago, my ardor for the upside swing has cooled a bit. On balance I think we go higher but the pace will most likely be subdued. For every good ISM report we have a riot in Spain because people can’t stay on the dole forever. I guess our time is coming too but that news still dampens the market in a hurry. It does appear that private capital is back to buying PIIGS debt, so most of what I look at has seen a cooling of the volatilities across the board even if we are not back to the lows in IV. Essentially we have an up and down market where ¾ of the world is growing and Europe is stuck. So I turn my attention to activity that pops up in individual names and to less broad market activity.

Below I have a Wednesday snap of very active names in the S&P 500. The tall dark green spikes are basically names that have dropped quickly (I have the landscape inverted) which I read as HV10 (10 Day and 30 day realized volatility) running over HV30. The short term realized volatility is much faster than the mid-term volatility. I selected NFLX yesterday afternoon (HRB was next to it on the bigger spike but not much interesting trading) and below was day 2 as things opened this morning.

5-3-2012 11-09-03 AM

5-3-2012 11-10-57 AM

Essentially, NFLX was leading the pack in underperformance after earnings, and the downward momentum is keeping the name near the top of the bottom of the heap. When stocks die they tend to die slowly after a poorly received report and NFLX is not an exception. The reality is competition creeping into their business even though I think they have a great delivery system. As May expiration approaches its leading weakness will probably persist. Short out of the money call spreads that are contract neutral (or net long contracts) might do the trick in the May or June cycle. Use any bounce to initiate. Usually when the market loses love the relationship is over for a month or two at least. The funky sentiment is not helping either.

Read more from Andrew at Option Pit

Wednesday, April 25, 2012

Aqumin Volatility Newsletter 04/25/2011 - $AAPL, $BAC, $C

Bobbing for Apples

Since AAPL reported last night I will let myself be drawn into the maelstrom of noise and give my two bits on what I see from the AlphaVision™ for Bloomberg point of view. From the fundamental side AAPL makes more money than any analyst thinks possible. AAPL already talked down the next quarter so I am sure there will be room to beat again. The first global company that combines high hardware margins with the power of the Cloud and internet is probably going to baffle the analysts for a while since this scale is really the first of its kind. So while AAPL sells more stuff to China today, let’s look at some relative volatility.

This landscape below is an end of day snap of the S&P 500 looking at 30 Day Historical Volatility and Market Cap. Green buildings are more volatile with dark green names trading over 40% HV30. I highlighted AAPL with C and BAC to illustrate a point. C is trading in the low 30% range for HV30 and BAC in the high 40% range. AAPL is trading in the low 30% range. The big difference is AAPL is a $600 (at least this am) number and C is trading around $33 and BAC is $8+. AAPL has been generating massive realized volatility for such a big name into earnings. The iPhone maker is generating HV30 at near the same level with the poster children of the 2008 financial crisis. From that point of view the balance of panic activity is moving away from the financials, which is probably good for the market as whole. The market is saying it is time to back to speculating on how much companies can make versus how fast they are going to 0.

4-25-2012 9-07-03 AM

After earnings, implied volatility comes down usually around 10 to 20% in the next available month in AAPL. The mistake after this earnings cycle would be to sell too much IV and ignore the big HV in the name. Selling juice in a financial stock going nowhere is one thing, selling juice in a $600 freight train is another.

Read more from Andrew at Option Pit

Thursday, April 19, 2012

Aqumin Volatility Newsletter 04/19/2012 - $KIM, $BXP, $PLD, $AVB, $SPG, $PNC, $C

Are the Financials moving in sync?

The Euro Zone is going to stay with the US Equity market for the foreseeable future. If anything, I think there is a dampening effect on whatever good news comes out of the economy. The issue now really is that the Euro Banks can no longer afford to put on the easy carry trade that the ECB made available and that the global bond market will have to suck up all of the available debt the PIIGS produce. As of today they want real money to loan money. How is that affecting the US Financial Stocks? Take a look below.

4-19-2012 10-36-12 AM

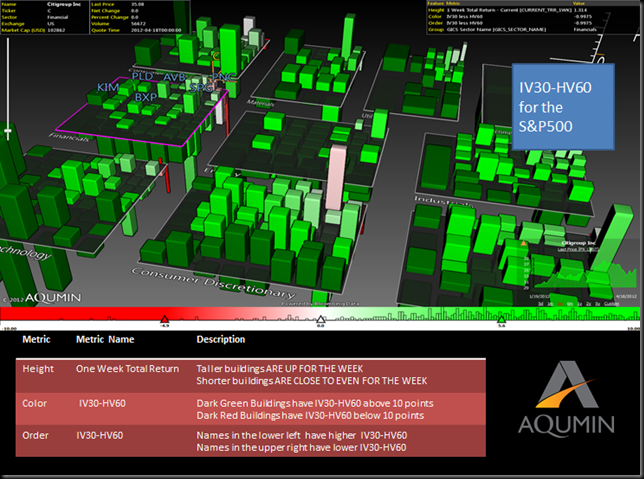
The AlphaVision™ for Bloomberg Landscape I am using is the standard IV30 – HV60 view. This is essentially my view for judging direction on the VIX and the other volatility products to see how much “weight” there is in the implied volatilities overall. The darker green buildings just mean that the IV is priced much higher than the individual names have been moving over the last 60 days. As we move into earnings season, this make sense (especially for Tech in the foreground) since most implied volatilities get bid up prior to earnings. As you look at the Financials in the S&P 500 they do not look out of the ordinary. Actually Citicorp “C” is looking darn right cheap right now post earnings on a relative volatility basis.

Zoom in below to see a detail of the Financials and I think something interesting is revealed. Note how all of the Financial REITS were up for the week while most of the money center banks got whacked (save for C and PNC).

4-19-2012 10-37-26 AM

This still reflects the situation in Europe even though most banks in the USA are probably avoiding European Debt for now. If the Property REITS are seeing a rebound with nothing untoward in implied volatilities, I think that bodes well for them moving forward. This might not be a bad time to pick up some of the better financials names that have already reported. If the property names can catch a bid, the banks that loan them the money are sure to follow.

Read more from Andrew at Option Pit

Thursday, April 5, 2012

Aqumin Volatility Newsletter–04/05/2012 – $AIG

A Little Irony

How the worm turns. After 20 years+ in the securities business it never ceases to amaze me that if you wait long enough (or can hold out) things can turn around. On a day when the latest Euro story threw cold water on our volatility crushing rally the big winner was, wait, AIG. Oh well…

Take a look at my AlphaVision™ for Bloomberg VWAP Landscape built by Aqumin’s Jason Javarone. This is my favorite way to watch daily activity. While I have up the major indexes I find that this landscape tells a better real time story in that stocks trading above VWAP show momentum higher (stocks on the bottom show negative momentum). At the end of the day (Wednesday) this is what a Sub Industry landscape looked like. These are most of the stocks that trade options and if they are green they are also up on the day. If they are dark green they are closing up 5% above daily VWAP. This is a great way to get market depth and way beyond what you can glean from traditional 2D heat maps.

4-5-2012 9-39-32 AM

On a day when the issue is really dominated by credit (or lack of easy credit for the Spanish) it is refreshing to see where money is actually flowing. It is flowing into the husk of the company that nearly took down the financial system. Also noteworthy in the news is that the big jet leasing facility, ILFC, a part of AIG, is getting better rates than the sovereign nation of Spain. Maybe AIG is not such a bad bet anymore and even Uncle Sam might break even on it.


Read more from Andrew at Option Pit